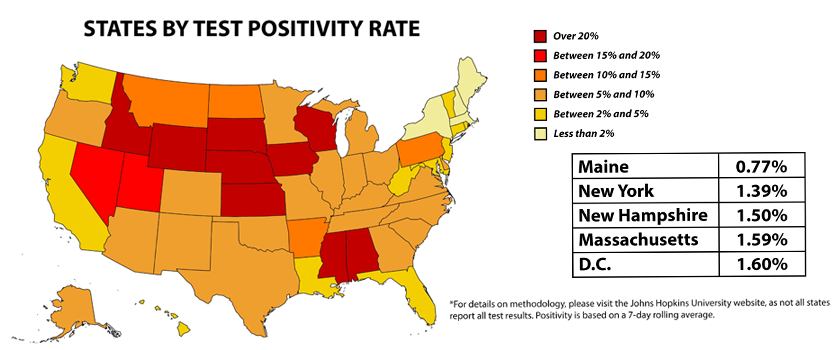
Governor Cuomo today announced that, per Johns Hopkins University’s Coronavirus Resource Center, New York State has the second-lowest COVID-19 positivity rate of any state in the country. Full rankings are below.
|
Johns Hopkins University State Positivity Chart
|
||
|
10/28/2020
|
||
|
RANK
|
STATE
|
POSITIVITY
|
|
1
|
Mississippi
|
100%*
|
|
2
|
South Dakota
|
43.44%
|
|
3
|
Idaho
|
34.81%
|
|
4
|
Wyoming
|
31.61%
|
|
5
|
Wisconsin
|
27.96%
|
|
6
|
Iowa
|
26.36%
|
|
7
|
Alabama
|
25.17%
|
|
8
|
Nebraska
|
21.78%
|
|
9
|
Kansas
|
20.73%
|
|
10
|
Nevada
|
18.91%
|
|
11
|
Utah
|
18.17%
|
|
12
|
Montana
|
14.47%
|
|
13
|
Pennsylvania
|
12.07%
|
|
14
|
North Dakota
|
10.90%
|
|
15
|
Arkansas
|
10.11%
|
|
16
|
Tennessee
|
9.61%
|
|
17
|
Arizona
|
9.29%
|
|
18
|
Texas
|
9.29%
|
|
19
|
Missouri
|
9.23%
|
|
20
|
Oklahoma
|
9.09%
|
|
21
|
Kentucky
|
8.83%
|
|
22
|
New Mexico
|
8.30%
|
|
23
|
Indiana
|
7.84%
|
|
24
|
Alaska
|
7.66%
|
|
25
|
Georgia
|
7.44%
|
|
26
|
Delaware
|
7.44%
|
|
27
|
North Carolina
|
6.91%
|
|
28
|
Minnesota
|
6.86%
|
|
29
|
Colorado
|
6.60%
|
|
30
|
Illinois
|
6.57%
|
|
31
|
Oregon
|
6.41%
|
|
32
|
Virginia
|
5.82%
|
|
33
|
South Carolina
|
5.66%
|
|
34
|
Ohio
|
5.64%
|
|
35
|
Michigan
|
5.31%
|
|
36
|
Florida
|
4.96%
|
|
37
|
Louisiana
|
4.64%
|
|
38
|
West Virginia
|
4.21%
|
|
39
|
Washington
|
3.77%
|
|
40
|
New Jersey
|
3.66%
|
|
41
|
California
|
3.21%
|
|
42
|
Rhode Island
|
3.03%
|
|
43
|
Maryland
|
2.64%
|
|
44
|
Connecticut
|
2.51%
|
|
45
|
Vermont
|
2.39%
|
|
46
|
Hawaii
|
2.23%
|
|
47
|
District of Columbia
|
1.60%
|
|
48
|
Massachusetts
|
1.59%
|
|
49
|
New Hampshire
|
1.50%
|
|
50
|
New York
|
1.39%
|
|
51
|
Maine
|
0.77%
|
*For details on methodology, please visit the Johns Hopkins University website, as not all states report all test results. Positivity is based on a 7-day rolling average.